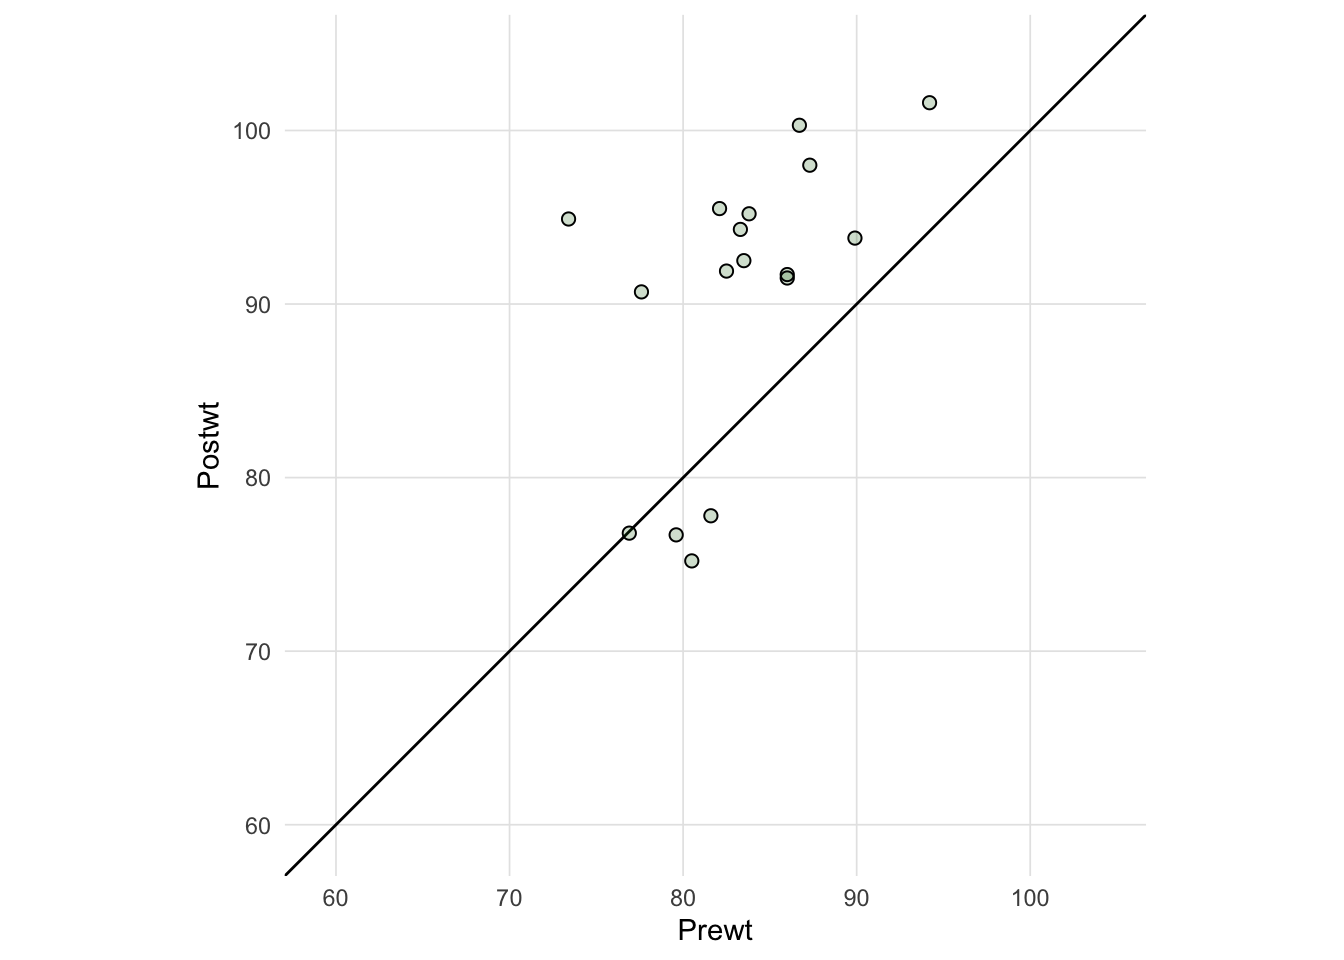
Show the code
data (anorexia.sub, package = 'granova' )dependent_sample_vis (df = anorexia.sub,test = 'norm' , # or 't' conf_level = 0.95 ,plot_mean = FALSE ,plot_unit_line = TRUE ,plot_projections = FALSE ,plot_differences = FALSE ,plot_ci = FALSE ,plot_ci_lines = FALSE ,plot_samp_dist = FALSE
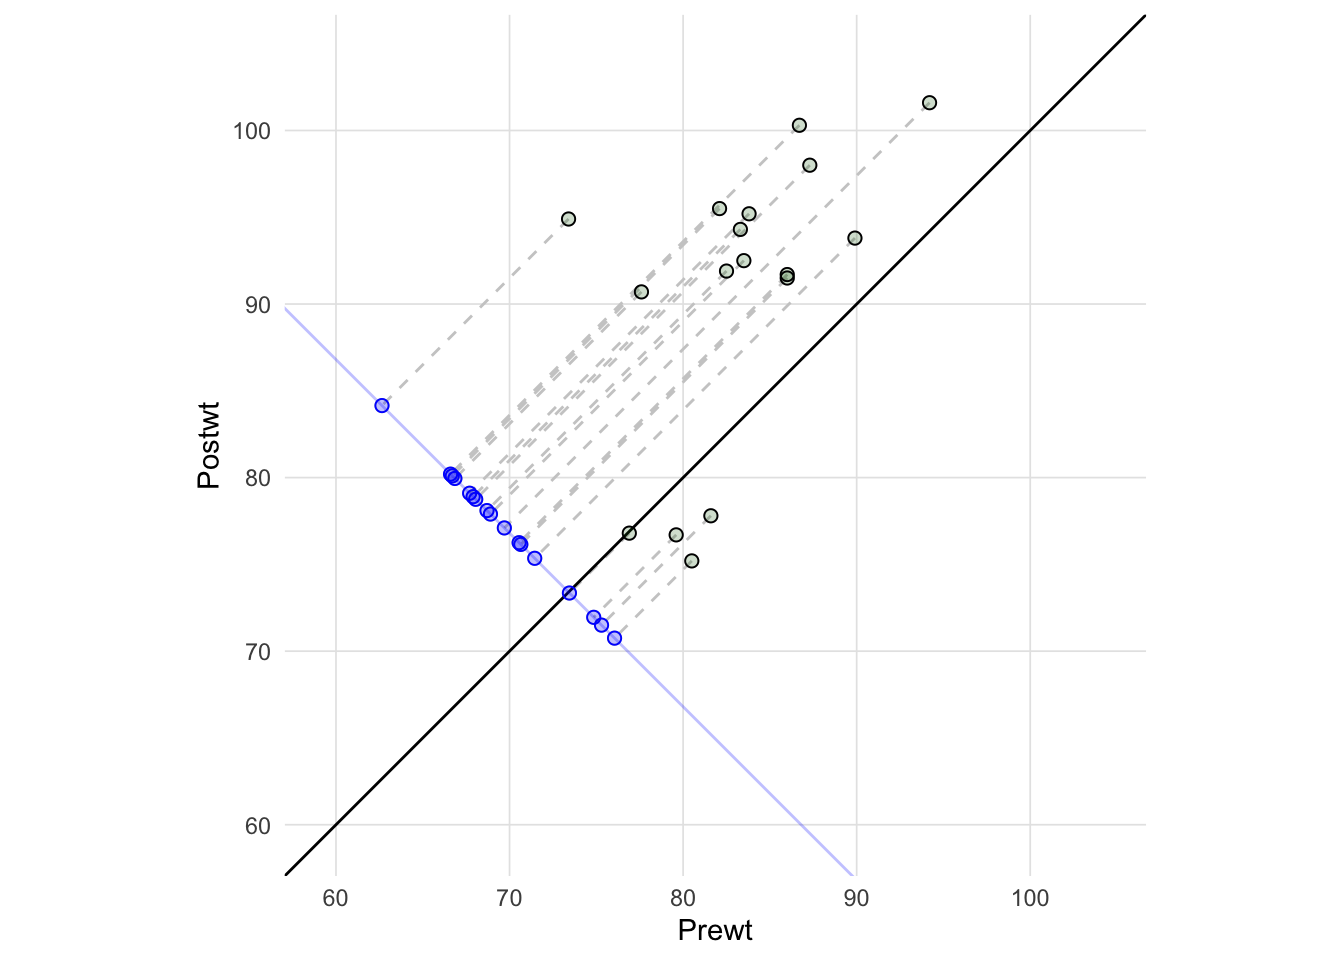
Show the code
dependent_sample_vis (df = anorexia.sub,test = 'norm' , # or 't' conf_level = 0.95 ,plot_mean = FALSE ,plot_unit_line = TRUE ,plot_projections = TRUE ,plot_differences = TRUE ,plot_ci = FALSE ,plot_ci_lines = FALSE ,plot_samp_dist = FALSE
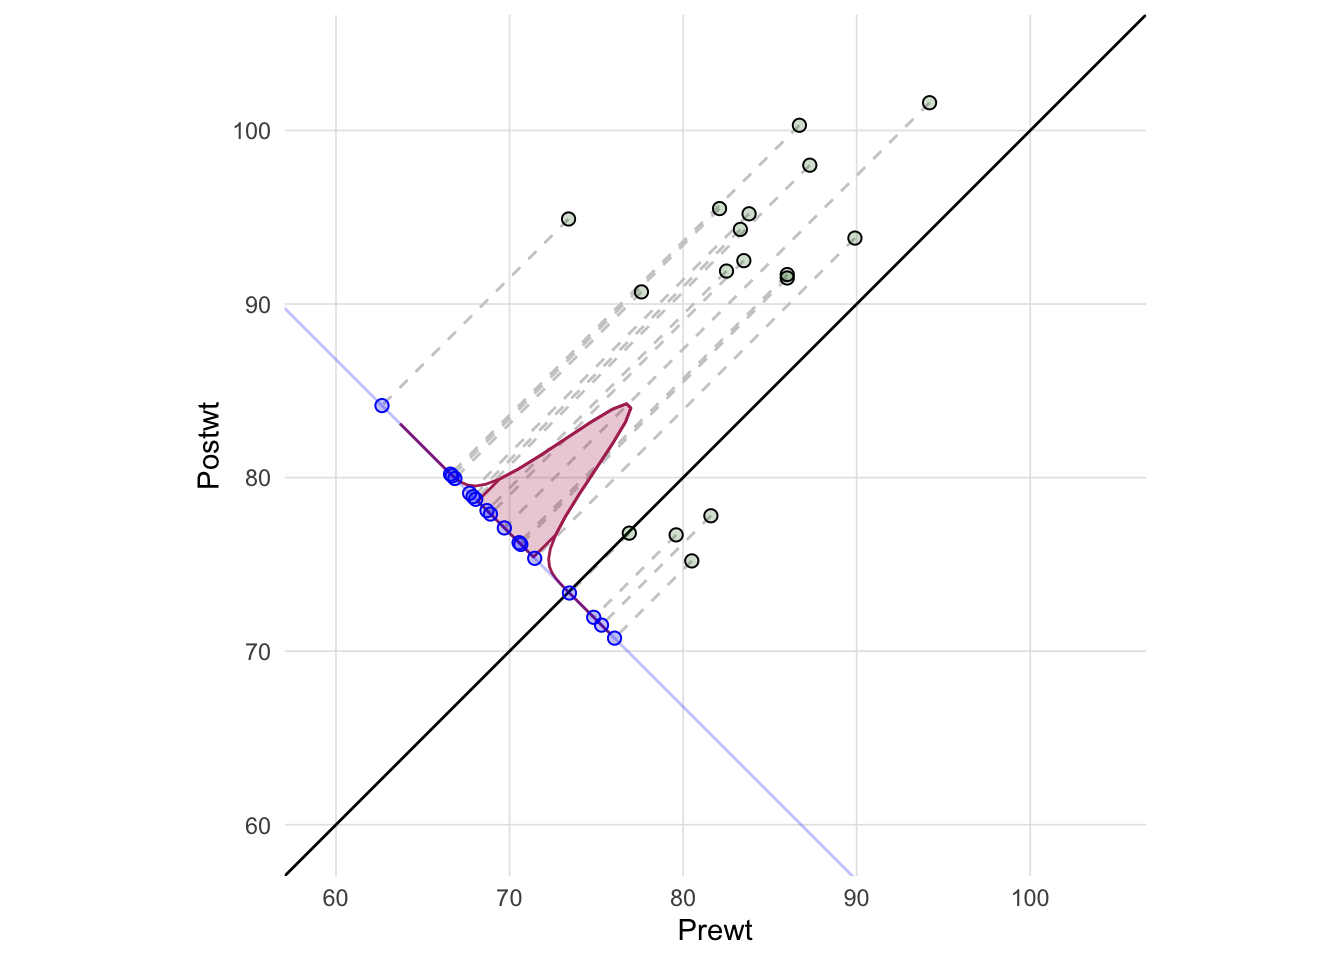
Show the code
dependent_sample_vis (df = anorexia.sub,test = 'norm' , # or 't' conf_level = 0.95 ,plot_mean = FALSE ,plot_unit_line = TRUE ,plot_projections = TRUE ,plot_differences = TRUE ,plot_ci = FALSE ,plot_ci_lines = FALSE ,plot_samp_dist = TRUE
Warning: Using `size` aesthetic for lines was deprecated in ggplot2 3.4.0.
ℹ Please use `linewidth` instead.
ℹ The deprecated feature was likely used in the VisualStats package.
  Please report the issue at <https://github.com/jbryer/VisualStats/issues>.
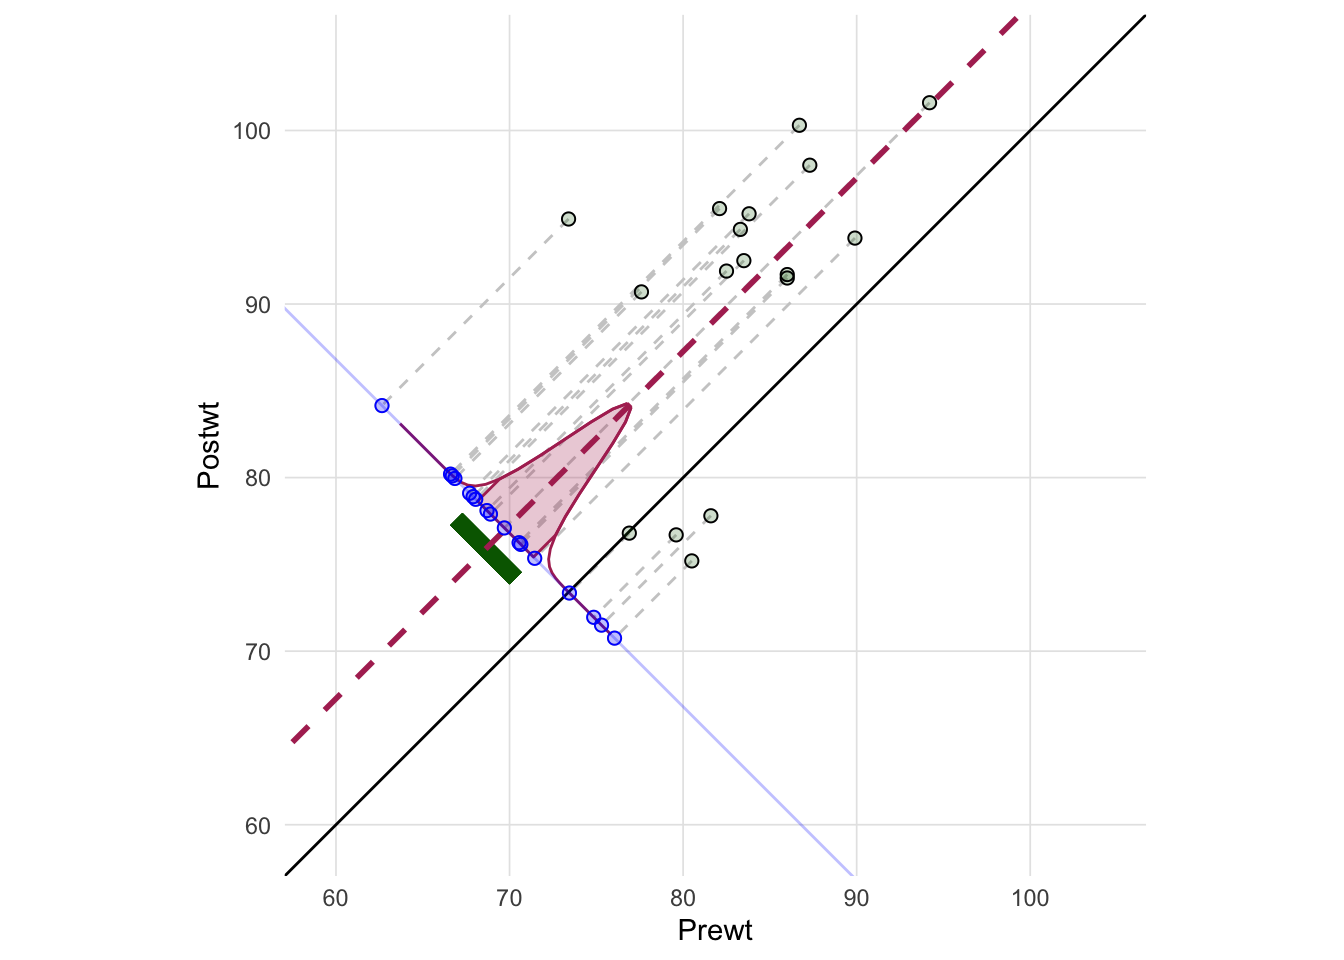
Show the code
dependent_sample_vis (df = anorexia.sub,test = 'norm' , # or 't' conf_level = 0.95 ,plot_mean = TRUE ,plot_unit_line = TRUE ,plot_projections = TRUE ,plot_differences = TRUE ,plot_ci = TRUE ,plot_ci_lines = FALSE ,plot_samp_dist = TRUE
This Shiny application can be run locally using the VisualStats::dependent_sample_shiny() function.