mean_x <- 20
mean_y <- 40
sd_x <- 2
sd_y <- 3
n <- 30
rho <- 0.8
set.seed(2112)
df <- mvtnorm::rmvnorm(n = n,
                       mean = c(mean_x, mean_y),
                       sigma = matrix(c(sd_x^2, rho * (sd_x * sd_y),
                                     rho * (sd_x * sd_y), sd_y^2), 2, 2)) |>
    as.data.frame() |>
    dplyr::mutate(cross_products = abs(V1 * V2))
lm_out <- lm(V1 ~ V2, data = df)
df$prediction <- predict(lm_out)
df$residual <- resid(lm_out)7 OLS Regression
Show the code
regression_vis(df, plot_regression = TRUE, plot_residuals = df$residual == max(df$residual))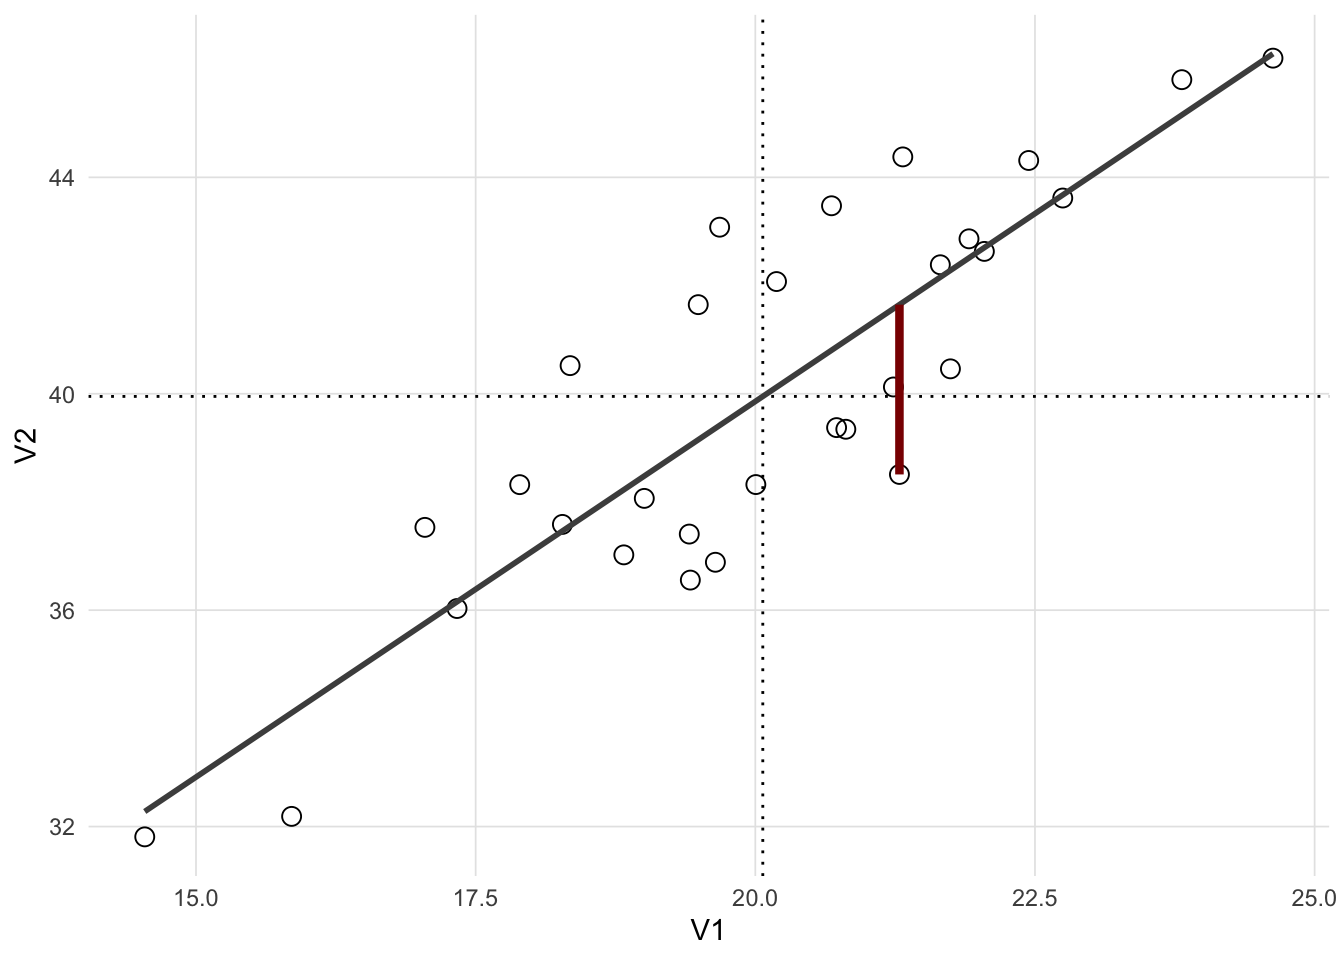
Show the code
regression_vis(df, plot_regression = TRUE,
               plot_residuals = df$residual == max(df$residual),
               plot_residuals_squared = df$residual == max(df$residual))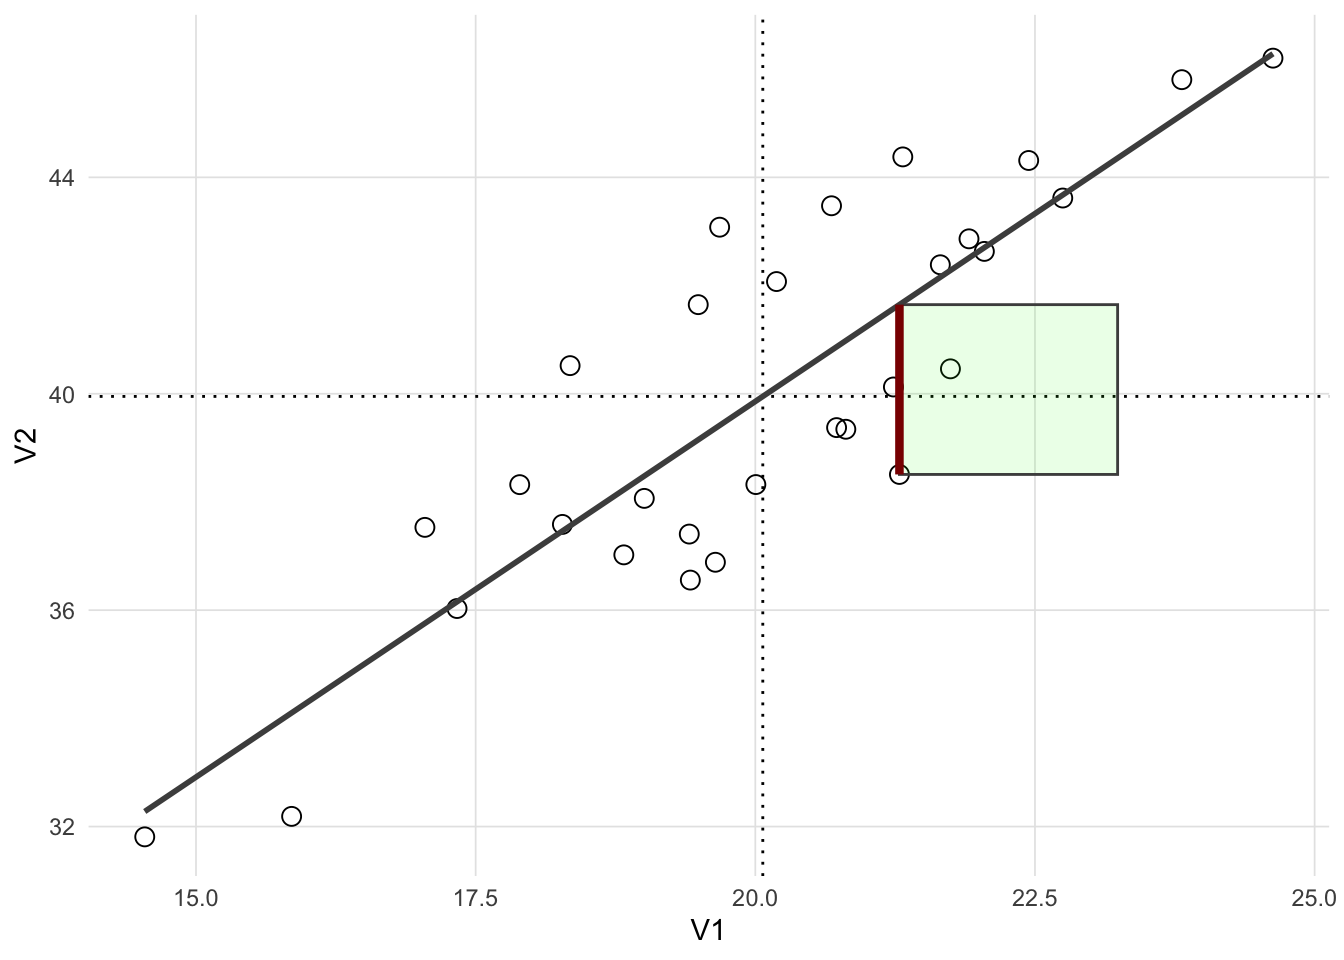
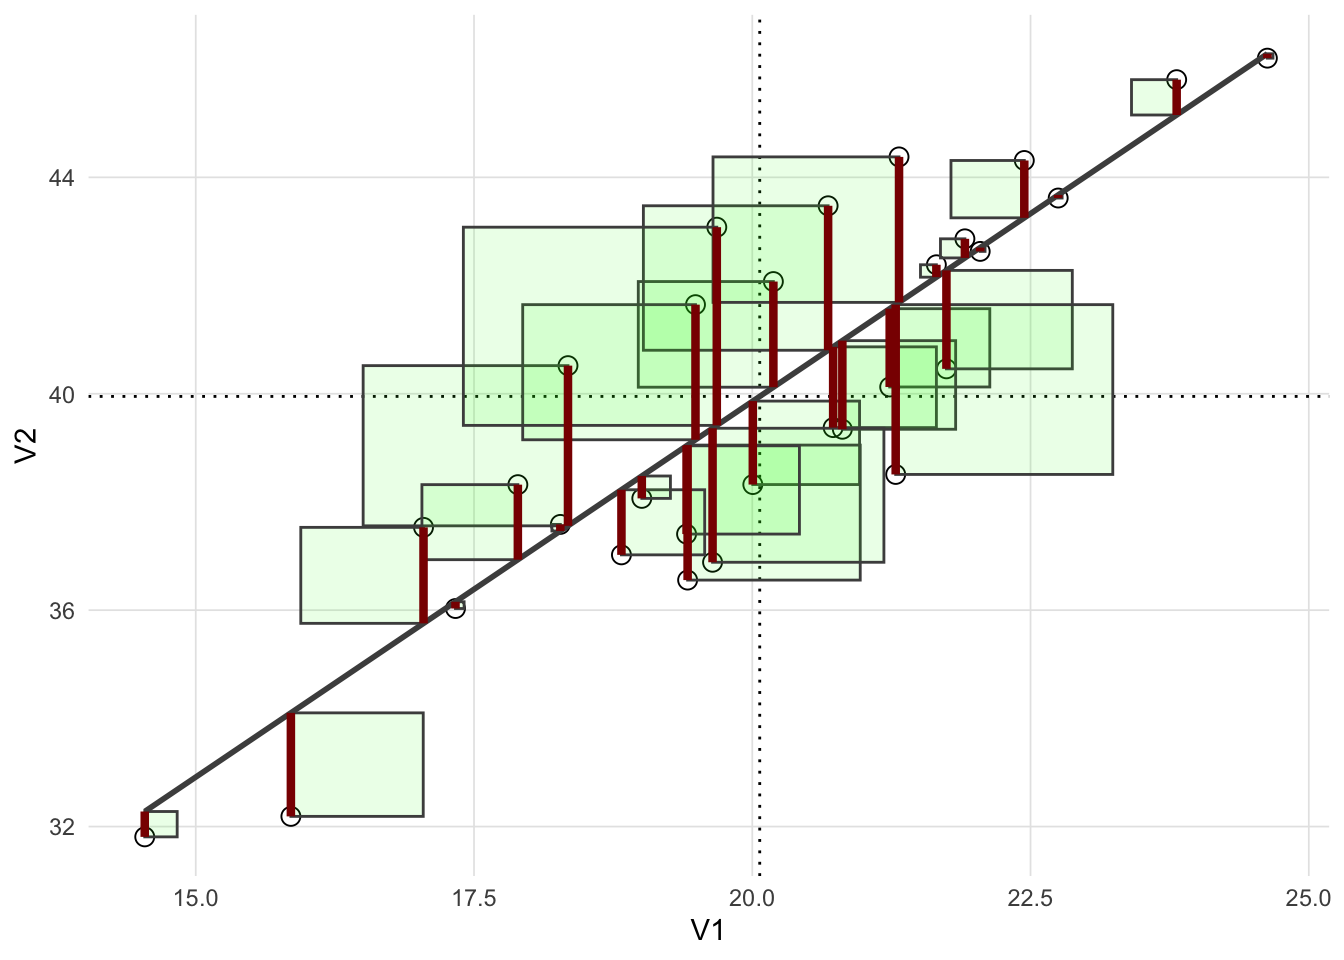
Show the code
regression_vis(df, plot_regression = TRUE,
               plot_residuals = TRUE,
               plot_residuals_squared = TRUE)